Best Business Intelligence Tools for Garnering Impactful Insights
With the remarkable proliferation of new technologies and digital transformation, data can now be garnered on every single aspect of a business, from separate departments such as sales, marketing, finances, HR to its overall performance and profitability. Nonetheless, a whole lot of these data points exist in isolation and require a dedicated IT platform to connect the dots together. This is where business intelligence (BI) comes into play!
Not only can these business intelligence tools take into account of specific details of business operations but they can also tie in key information from each angle into an overall whole, allowing for crystal-clear insights and data-driven predictions to ignite your business performance.
Since there is a plethora of BI software on the market as well as the various ways that they are packaged, beginning the selection process and narrowing down your options can be quite confusing. But don’t panic! Let’s walk through our pick for the top business intelligence tools to figure out your best fit!
#1: Zoho Analytics
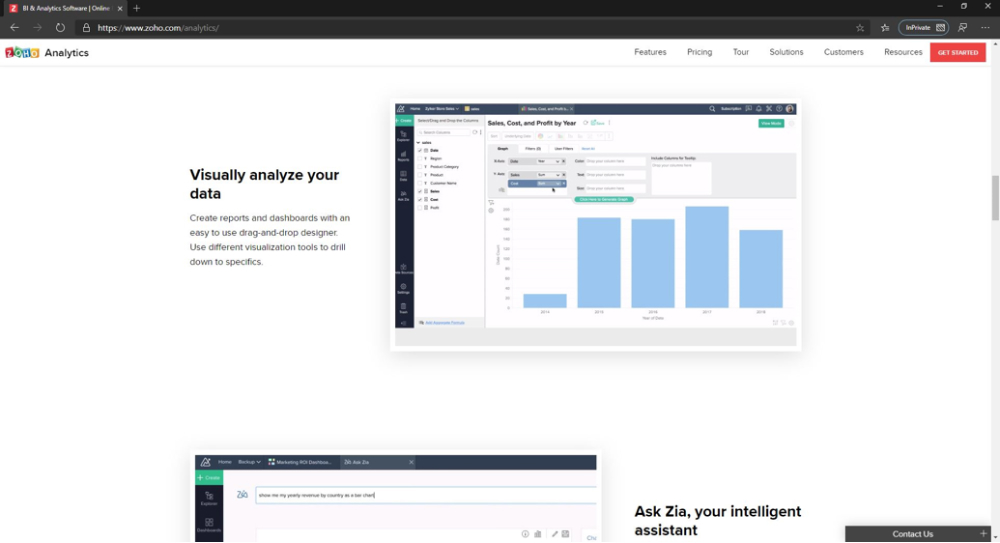
Zoho Analytics – previously known as Zoho Reports – is a robust self-service data analytics platform that comes with the Zoho Productivity Suite. The BI-centric software does provide users several highly configurable, easy-to-use tools that can help you to streamline the aggregation of data from multiple sources while speeding up report generation and simplifying the visualization of information for use in presentations.
Without the need for IT assistance or data analysts, Zoho Analytics can integrate data from a variety of files – including Microsoft Office documents, URL feeds, and databases, such as MySQL, bring actionable insight as well as perform in-depth analysis to these business data points on-demand. Besides, it has a scalable interface, meaning it can be used effectively by companies of all sizes – no matter how extensive or limited your datasets may be.
Key Features:
- Reports and dashboards
- Self-service BI
- Embedded analytics
- Auto-Joined data
- iOS and Android mobile apps
- Scheduled data backup and email
- Drag-and-drop interface
- REST API
- Geo visualization
- Ask Zia – Smart analytical assistant built out of a blend of AI and machine learning algorithms
- KPI widgets
Pricing:
Zoho Analytics offers some pricing options for its cloud-based deployment, based on your business needs:
- Free Plan: Free – 2 users and 10,000 rows/records
- Basic Plan: $22/month (billed annually) – 2 users and half a million rows/records
- Standard Plan: $45/month (billed annually) – 5 users and 1 million rows/records
- Premium Plan: $112/month (billed annually) – 15 users and 5 million rows/records
- Enterprise Plan: $445/month (billed annually) – 50 users and 50 million rows/records
Should your number of users exceed the available tier on the plan, you can easily add more at $8 per user per month. Besides, there is a free trial of 15 days.
#2: Looker
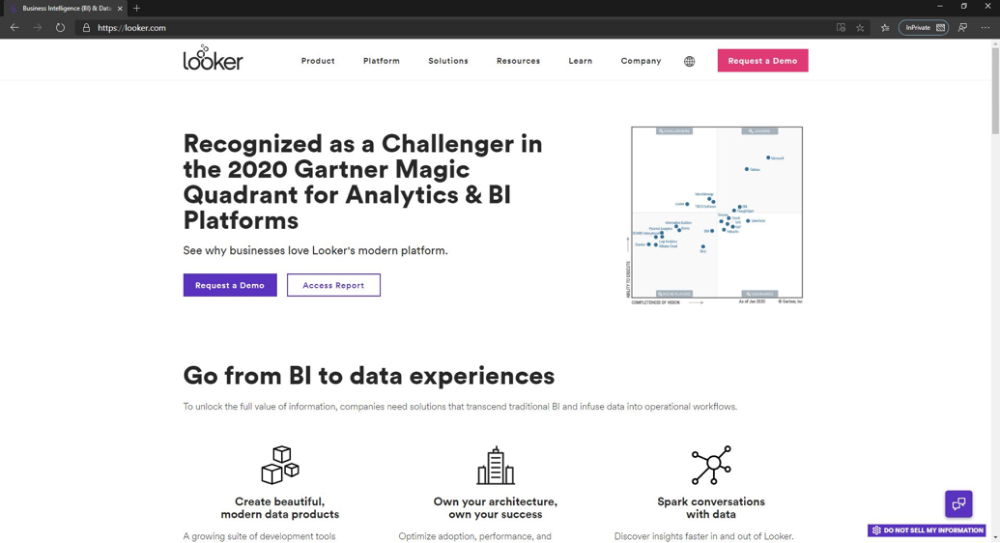
Just like Zoho Analytics, Looker is a web-based data discovery and analytics solution that empowers users to explore, discover, visualize and share data insights. However, whereas most business intelligence tools put data visualization at the forefront of their offerings, Looker is more interested in letting its users explore their data in any way they want.
Actually, Looker has made it to the top one amongst various business intelligence tools for its intuitive data exploration approach. Its web-based interface will empower you to exploit the expertise of your company’s analytics teams, build and share reports among them in an instant, helping to drive data-driven decisions and actions.
In general, Looker is geared toward a slightly more tech-savvy audience, with a built-in data modeling language (LookML) and git integration to extend and enhance SQL-based analysis. Adopting a simple proprietary modeling language, such a BI-centric reporting system lets users define data relationships while bypassing SQL. It does facilitate data literacy and accessibility for users of all technical skill levels as well as data analysts.
Key Features:
- Automated modeling
- Apis for integration into custom or third-party applications
- Browser-based interface and customizable dashboards
- LookML data modeling language
- Fully customizable and exportable reports, charts and graphs
- Time zone handling
- Live connection to any SQL database, on any infrastructure
- Modern ide for agile development and embellishment
- Reliable tech support and self-learning database
- Drag-and-drop mechanism
- Collaboration features
Pricing: Upon request (with no free trial)
#3: Power BI
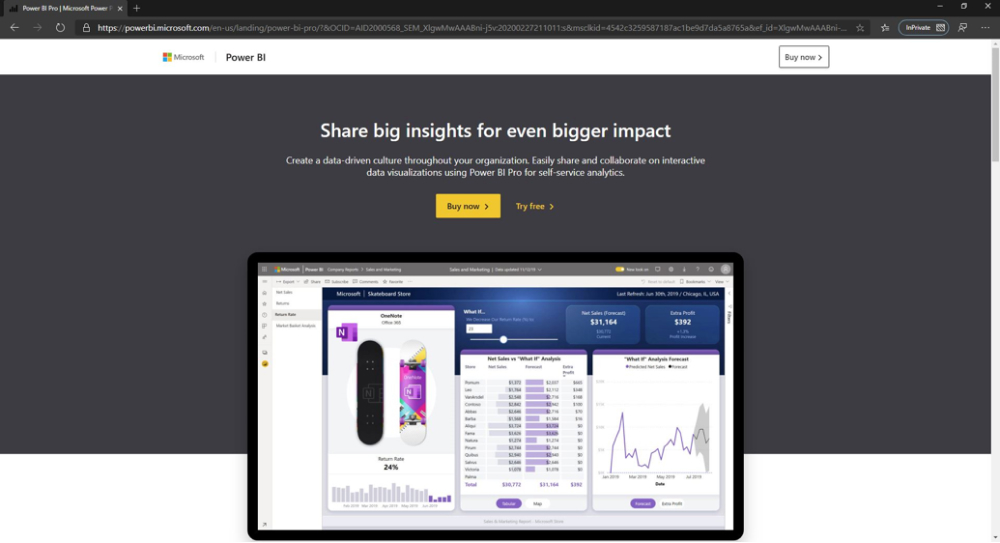
Initially released in 2011, Power BI – Microsoft’s offering in the business intelligence tools space – is a super-powerful tool designed to “create a data-driven culture with business intelligence for all”, enabling everyone at every level of your organization to make confident decisions using up-to-the-minute analytics.
Besides, it offers a simple interface that allows users to create their own dashboards and reports. Thus, users can easily employ this robust software solution to connect data sources, visualize patterns and discover insights. It’s noteworthy that Power BI will be a great add-on for any Windows-centric data workflow, especially in combination with Azure. Nevertheless, its performance tends to lag on very huge data sets, so that you may wish to look elsewhere if your data is really big.
The solution comes in two forms:
- Power BI Services – A SaaS deployment
- Power BI Desktop – The on-premise based version
Key Features
- Data source connectivity (both on-premises and cloud-based)
- Self-service power query process
- Intuitive data visualization
- Pre-built or custom dashboards/reports
- Natural language processing
- Secure data governance
- Mobile compatibility
- Embedded analytics
- Seamless integration (third-party data sources such as Spark, Google Analytics,…)
- On-premises or cloud server
- Collaboration features
Pricing:
There are two Power BI pricing available for your choice:
- Power BI Pro: $9.99 per month per user (with a free trial)
- Power BI Premium: $4,995 per month per dedicated cloud compute and storage resource with annual subscription
#4: Domo
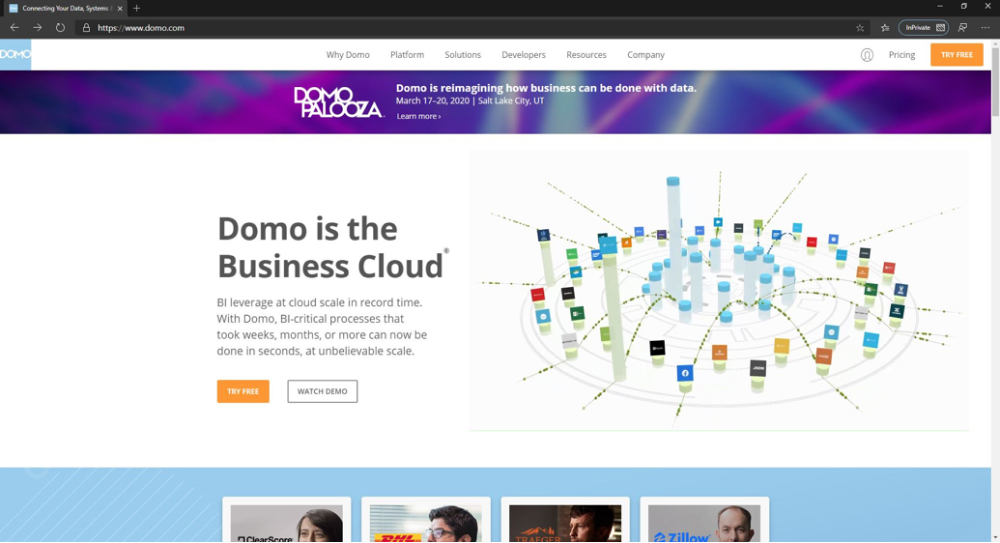
Domo is another awesome self-service business intelligence (BI) tool that offers the super-large data set and connector support as well as delivers a unique set of social collaboration features. Besides, it is the only cloud-native platform that combines iPaaS capabilities for data integration, visualizations for real-time and predictive insights – and a foundation for building your own apps to take immediate action on those insights and form viable solutions to today’s most pervasive business challenges
In practice, Domo does perform both micro- and macro-level analysis and presents these analyses in interactive visualizations to make patterns obvious to users, facilitating the discovery of actionable insights. Also, through shared KPIs, you’ll find it much easier to overcome team silos and work together across departments.
Key Features:
- Intuitive dashboards
- Flexible business data connection options and integration
- Clear-cut insights into business data
- Project management
- ETL tool
- Buzz – communication & messaging platform
- Appstore – app bundles designed by third-party developers
- Data visualization
- Social sharing tools
- Optimized mobile platforms
Pricing: Upon request
#5: QlikView
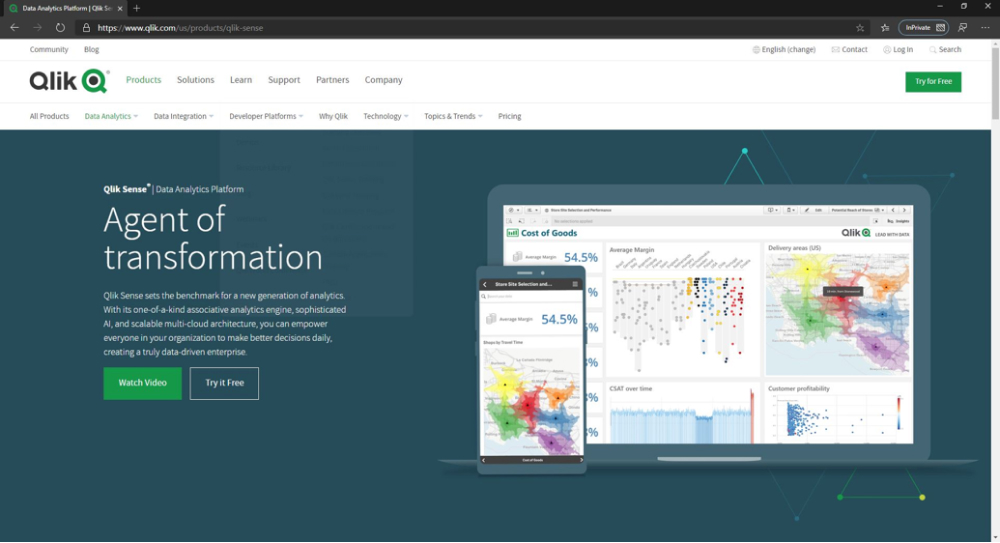
QlikView is an end-to-end data integration and data analytics platform from Qlik – a leader in the insight and business intelligence space. It has been built from the ground up to be affordable, scalable and also adaptable.
This easy-to-use BI platform QlikView automatically generates personalized reports and customizable dashboards. By employing associative data indexing, this BI-centric tool can empower you to explore massive data, discover hidden trends and patterns that can be used to drive sound business actions.
To ensure a seamless flow of data between various systems, QlikView also offers both default and custom data connectors and open database connectivity connections. With the system’s open API, you can rest assured that QlikView can blend in literally every software ecosystem, and consequently eliminate the need to use several different systems to process data.
More than that, unlike the traditional systems, QlikView reveals connections not easily found by standard tools. It features strong collaborative capabilities to render insights and decisions about them a truly team effort!
Key Features:
- Data visualizations
- Speedy deployment; fast configuration
- Open and dynamic BI ecosystem
- Interactability with dynamic apps, dashboards, and analytics
- Robust data controls
- Default and custom connectors
- In-Memory application
- App scripts and Workbench
- Roles & Permissions
- Secure, real-time collaboration
- Advanced reporting templates
- Custom reports
- Mobile-ready
Pricing: Upon request
#6: Logi Analytics
Should you look for the BI tool with the embed analytic content critical capability, Logi Analytics is going to be your seamless match!
Logi Analytics, which was formerly known as LogiXML, is amongst the leading embedded analytics development platform with embed cutting-edge dashboards, reports, and self-service in your application. It does offer interactive data analytics and visualization, providing you with advanced reporting and visualization features.
Whereas functionality is the most critical factor when it comes to creating embedded analytics applications, unique user experience is just as vital. With Logi Analytics, you can easily combine pre-built objects and elements that accelerate app building and facilitates the creation of a differentiated solution. To ensure that valuable business information is protected against snoopers, this BI tool also integrates with your company’s current security framework to activate different security measures.
Key Features:
- Low-code development
- Self-service analytics
- Open web architecture
- Security options
- Single sign-on support
- Themes library
- Theme editor
- Custom styling & branding
- Custom plug-ins
- Javascript embedding API
- Interactive dashboards
- Reports
- Data blending & co-presenting
- Connected data sources (such as Microsoft SQL, Oracle, Hadoop, NoSQL, etc.)
- Client-side interactive visualizations
- Exporting capabilities
- Workflow management
Pricing: Upon request
#7: Redash
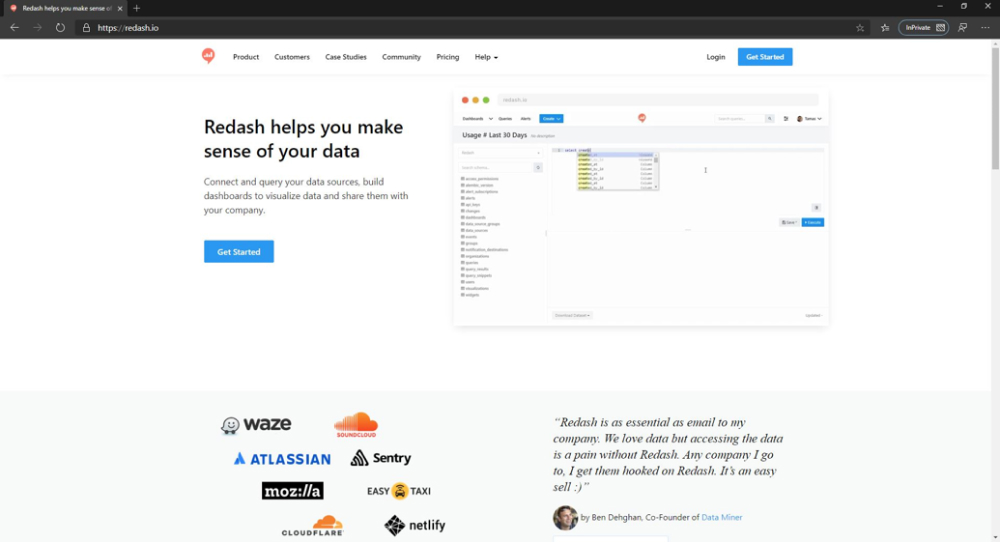
Redash is an open-source business intelligence tool with customizable features, no lock-in and major contribution back to the community. It does offer a SQL first interface, a focus on collaboration and system for Webhook alerts.
In fact, there exist a couple especially unique aspects of Redash. First of all, Redash is an Open Source project which is heavily influenced by its community so that if you wish to feel like you are part of a community building a product, Redash will be a perfect fit. The second is its slick visual integration with Slack that is likely amongst the crowdsourced features that came from the dedicated community. Actually, you can choose to host the platform yourself if you can handle the configuration and some maintenance.
Key Features:
- Ad-hoc reports
- Cohesive dashboards
- Performance metrics
- Effective queries
- Scorecards
- Data connectors
- Visual analytic
- Alerts
- Collaboration features
- Publishing / Sharing
- Open-source architecture
Pricing:
- Starter plan: $49/month – unlimited users, 3 data sources, 5 dashboards & 100 saved queries
- Pro plan: $99/month – unlimited users, 10 data sources, 50 dashboards & 1000 saved queries
- Business plan: $450/month – unlimited users, data sources, dashboards & saved queries
Each with a free trial of 30 days
#8: InsightSquared
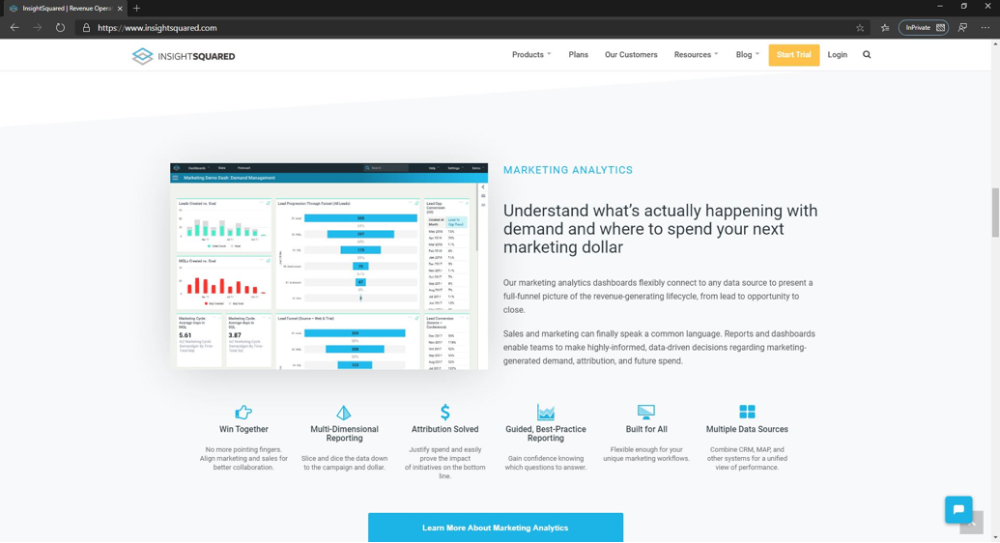
Tailored specifically to aid with sales, marketing, finances, staffing, and support services., InsightSquared is a perfect performance analytics solution for detailed insights about specific aspects of a company’s operations. Besides conducting analysis and drafting reports, InsightSquared allows you to forecast closed business deals, win rates of specific employees, identify high-opportunity leads, compare forecasts to historical sales averages and much more!
Key Features:
- Company-wide financial reporting
- Customer case management and analysis
- Customer & Sales rep KPI analysis
- Customer support trend analysis
- Customizable reports
- Employee activity dashboard, scorecard and goal tracking
- Insight feed and scheduled email alerts
- Marketing campaign analysis
- Pipeline management
- Pipeline trend analysis
- Revenue and expenses reports
- Sales cycle and won/lost analyses
- Sales forecasting
- Salesforce and Quickbooks integration
- Suite of campaign and lead reports
- Pre-built report library
Pricing: Upon request
#9: Keen
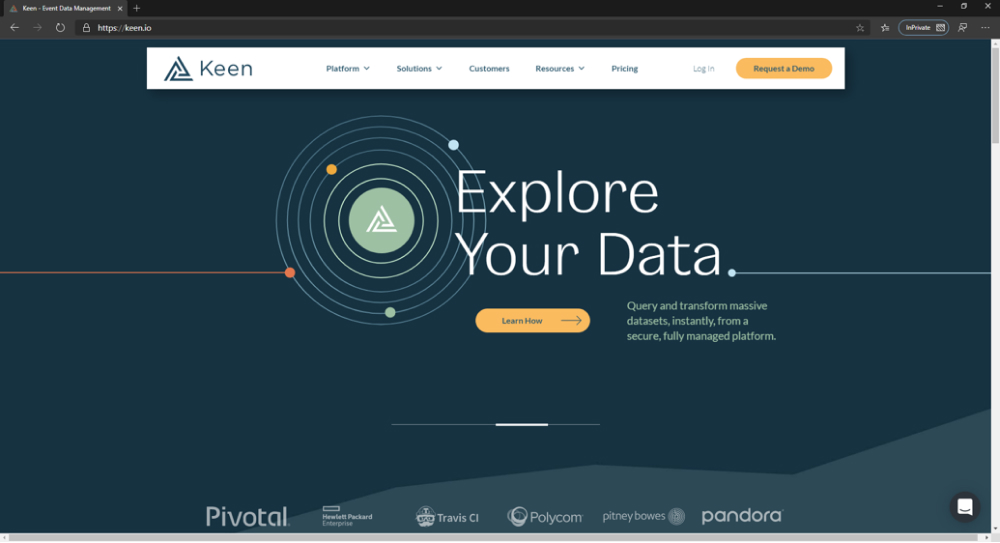
Keen IO, or also known as Keen, claims to be the all-in-one solution for event data management, handling all aspects of your event data management, from collection to application. To be more concrete, it conducts all the jobs of streaming, storing, querying, and presenting your data all in one place and then help you to get a competitive advantage over the competition.
Also, being an embedded analytics service focusing on customer-facing data reporting, Keen allows for real-time data presentation, relying on a robust network of APIs, SDKs, and integrations to discover and process big data.
Furthermore, “with Keen, we’re able to spot some cases of memory leaks in the field. Finding these problems before they’re critical helps decrease outages, which keeps customers happy. We’re also able to schedule fixes, instead of having to react immediately to an unplanned outage.” – Eric Nylander, Principal Software Engineer, Polycom
Key Features:
- Real-time dashboard
- Security Measures (transfer by HTTPS and TLS, AES encryption, API access keys)
- Data source integrations
- Keen data explorer tools
- Metadata management
- Process management
- Match & merge
- Hyper-specific data queries
- Access keys
- Visualization library
- Auto-collector
- SDKs and APIS
- Relationship mapping
Pricing: Keen has designed some simple and flexible pricing plans as follows:
- Team Plan: $299/month – 250,000 events; 5,000 queries; 5 cached queries & 5 cached datasets
- Business Plan: $999/month – 5,000,000 events; 25,000 queries; 50 cached queries & 50 cached datasets
Additionally, there are some add-ons and overages (with respective prices_ tailored to your specific business needs.
#10: Vyopta
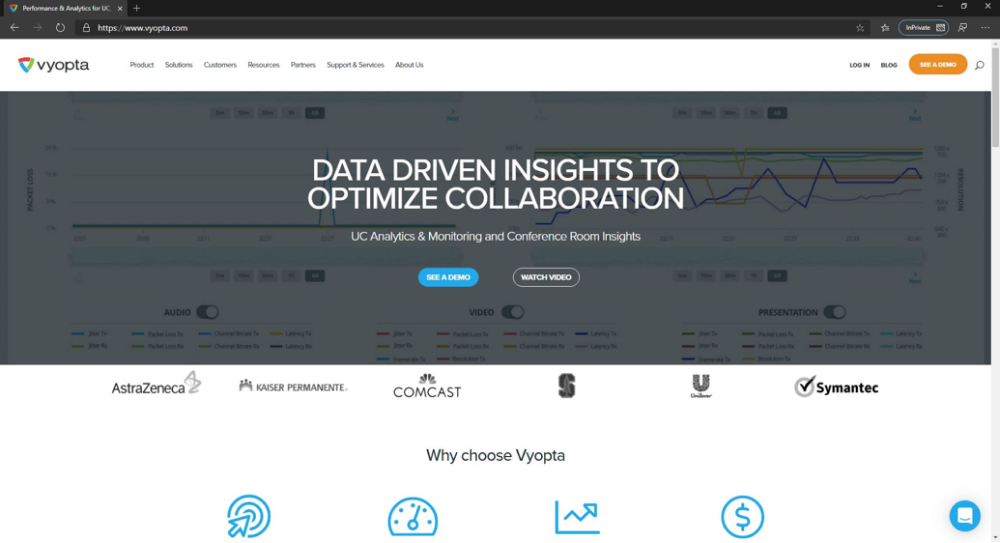
Formerly known as vAnalytics, Vyopta is an analytics platform built specifically to “transforms how enterprises work by making UC&C (Unified communications and collaboration) easier to manage”. Until now, it has monitored and improved the performance of UC systems and collaborative technologies such as Cisco, Microsoft, BlueJeans, Polycom and more.
Actually, this unique BI tool provides visibility across business workplace collaboration environments, helping organizations reduce blindspots, make data-driven decisions, and efficiently manage UC systems and meeting spaces. Vyopta’s CPM suite includes two modules: Monitoring and Analytics, with different capabilities.
Key Features:
- Collaboration Performance Management (CPM)
- Holistic UC coverage (multi-modal and multi-vendor analysis of all voice, video and messaging communications systems)
- ROI visualization
- Adoption metrics
- License and capacity planning
- Powerful data management
- Scalable architecture
- Problem tracking and alert
- Automated reporting
- Interactive UI & dashboards
- Vendor support (major technology vendors such as Cisco, Microsoft, Lifesize, Dolby Voice, etc.)
Pricing: Upon request
#11: Sisense
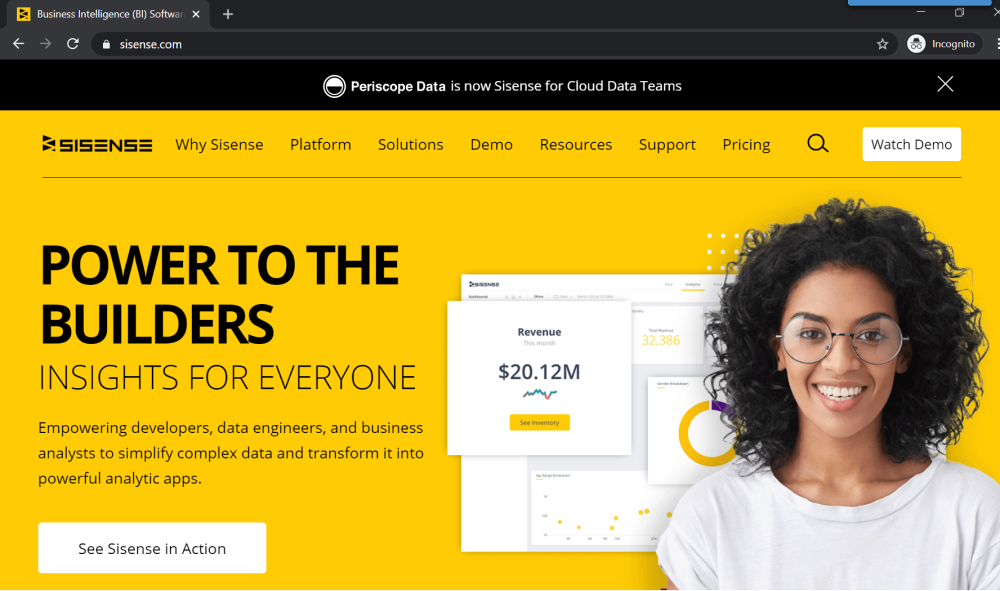
SiSense is amongst the leading cloud-native business intelligence tools that seek to simplify the complexities of data analysis by building in IoT, machine learning and AI into their platform. This tool is claimed to be so simple and streamlined that you can go from “data to dashboard in just 90 minutes.”
Actually, with Sisense, you can easily unify all your data into visually appealing dashboards via a drag and drop interface. Its major features include the ability to embed white label analytics with customizations, mashup live or cached data, analyze data across your entire landscape or focus on specific areas such as objects, data, or system.
What’s more, Sisense’s “business intelligence” is readily accessible for each member of your business as the software ensures easy discovery of business insights regardless of their experience in the field or the complexity of data. Eliminating data preparation nightmare, Sisense’s Single-Stack system allows you to do multiple tasks from data integration to visualization in a single BI platform. Its pricing strategy is also very flexible and can be adjusted to the individual needs and budget of your company.
Key Features:
- Ad-hoc analysis
- In-house setup
- Centralized data hub
- Visualizations
- Scalable analytics
- Metrics identification
- Non-programming/SQL writing business query
- Data collection, filtering, consolidation & storage
- Data connectors
- Data export to various formats
- Scalable data handling
- Embeddabble widgets & dashboards
- Apps & sites integration
- Single-Sign-On
Pricing: Upon request
#12: Reveal
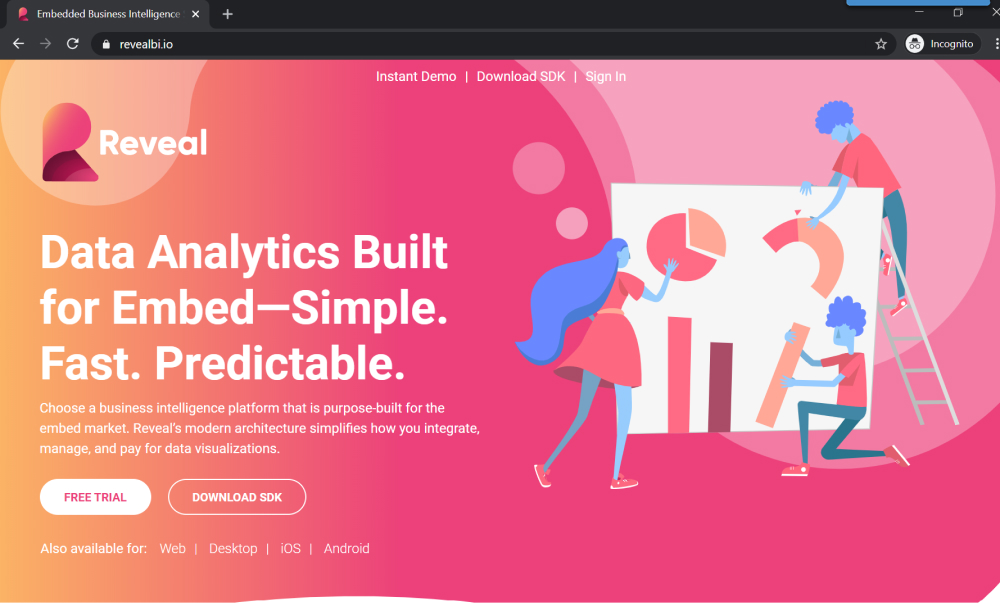
Built for embedded analytics scenarios, Reveal – formerly known as ReportPlus – is a self-service business intelligence and analytics solution designed for midsize and large enterprises. Just like other popular BI-based tools, Reveal adopts a user-friendly interface that has drag-and-drop capabilities, intuitive swiping, and a wide array of visualization types.
Since Reveal is designed by user experience experts, the task of creating dashboards is streamlined and done with ease. For any mobile device – be it Android and iOS smartphones and tablets, Reveal app is touch-enabled, allowing you to easily transform your ideas into actual visual representations. In fact, with its straightforward and flexible architecture, no advanced coding or technical skills are required to navigate the platform.
Amazingly, this platform offers handy solutions for various processes, including sales, finance, marketing, and operations. It enables you to obtain real-time insights and KPIs as well as transform them into valuable reports and analytics for a data-driven approach in your business processes.
Key Features:
- Unlimited intuitive dashboards
- Broad variety of integrations
- Multiple data sources
- Deployment concierge
- Real-time data
- Scheduled data refresh rates
- Advanced IT administrator capabilities
- KPIs & metrics
- Finance performance
- Email marketing
- Attrition rates
- Pipeline reporting
- Business operation management
- Social media analytics
- Website analytics
- Insurance analytics
- Mobile apps
Pricing:
Reveal offers two options for transparent enterprise pricing:
- Monthly Subscription: $9.99/user/month
- Annual Subscription: $99.99/user/year
Besides, a 14-day free trial is available.
#13: SAS Business Intelligence
Being a part of SAS Enterprise Solutions, SAS Business Intelligence is a cloud-based enterprise analysis tool that empowers its users to monitor key metrics and manage interactive reports.
This platform comprises six key modules, which includes SAS Visual Analytics, SAS Visual Statistics, SAS Office Analytics, SAS Enterprise Guide, and SAS Enterprise BI Server. Such a seamlessly integrated suite offers a range of helpful BI tools and features – ranging from customizable dashboard, interactive visualizations, marketing reports, to forecasting, data source connectors, ad-hoc analysis, and much more.
In addition to essential BI-centric “traits” of data gathering, analysis, and visualization, SAS Business Intelligence also comes with additional advanced features such as statistical simulation, association discovery, web services, multiple data sources, metadata management and more. Support is extended via documentation, phone, and email and pricing is available on request.
Key Features:
- Self-service business intelligence
- Ad-hoc reports
- Data source connectors
- Data visualization
- Multivariate and regression analysis
- Personalized dashboard
- Mobile bi and reporting
- Association discovery
- Visual and predictive analytics
- Forecasting
- Effortless collaboration
- Trend/problem indicators
- Multiple data sources
- Metadata management
Pricing: Upon request (with a Free Trial)
#14: Tableau
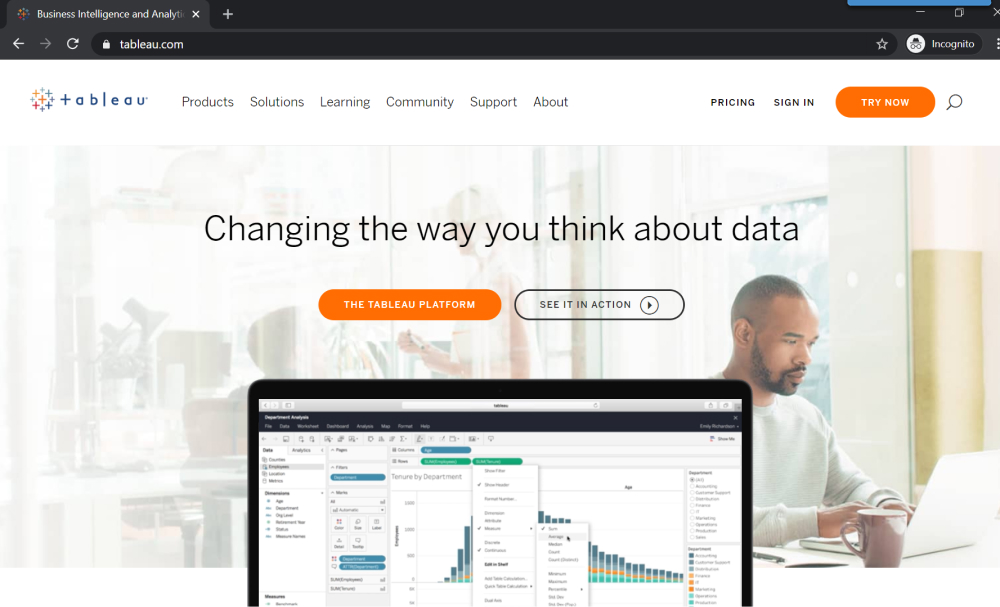
Amongst the leading intuitive business intelligence tools, Tableau platform provides the breadth and depth of capabilities that every single business needs, and adapts to your environment with unmatched flexibility and choice, while meeting the toughest governance and security requirements. With simple drag-and-drop features, robust drill-down as well as user-friendly visualization tools, all types of users will be able to easily access and analyze key data, build out innovative reports, and share critical insights across different teams.
Tableau has four main products for robust data discovery:
- Tableau Desktop: Designed to connect and analyze data sourced from hundreds of locations, both in the cloud or on-premise, to commence analysis and discover impactful insights.
- Tableau Server: Designed to securely collaborate and share critical insights and information through comprehensive dashboards created in Tableau Desktop or directly in Tableau Server.
- Tableau Online: Being a cloud-hosted version of Tableau Server, this platform offers accessibility for users anywhere at any time, provides self-service analytics and eliminates the need for configuring servers, scaling hardware capacity and managing software upgrades.
- Tableau Prep: built for organizations to conduct data preparation at scale, accelerating data analysis and combining, shaping, and cleaning data – without writing code
Key Features:
- Patented technology from Stanford University
- Toggle view and drag-and-drop
- Native data connectors
- Embed dashboards
- Mobile-ready dashboards
- Data notifications
- Dashboard commenting
- “No-code” data queries
- Stringing insights into a guided story
- Metadata management
- Automatic updates
- Security permissions at any level
- Tableau Public for data sharing
- Server REST API
- Collaboration features
Pricing:
- Tableu Viewer: $12/user/month
- Tableu Explorer: $35/user/month (billed annually)
- Tableu Creator: $70/user/month (billed annually)
Each with a Free Trial.
#15. Yellowfin
Being a business intelligence platform, Yellowfin is a single integrated solution developed for businesses of scaling sizes and across varying industries – accounting, advertising, agriculture, banking, insurance, manufacturing, media, marketing, food and beverage, engineering, retail, technology, and several other fields. This tool is specifically designed to expedite the process of yielding actionable insights and data-driven predictions from your company’s performance.
Rather than just simply presenting the results of your operational activities, this single-integrated analytics platform takes a step further by offering you in-depth explanations on why you got these results, thus enabling much deeper insights into your data and smarter business decisions.
Furthermore, as an end-to-end analytics solution, this BI-based tool does deliver a complete BI stack by separating a product for analytics and another for data transformation. Its suite of solutions also includes market-leading collaboration tools and automated insights. With its fully-integrated, web-based ETL and visual-data preparation tools, you can immediately dispatch data for analysis!
Key Features:
- Assisted insights
- Dashboards
- Data visualization & storytelling
- Several data sources
- Data preparation
- Data governance & transformation
- Alerts and broadcast
- Collaborative BI
- Mobile app
- Web API
- Relational database
- Admin console
- Data quality
- Approvals
Pricing: Upon request
The Bottom Lines
Would you like your data management becomes more cohesive, stable, agile as well as predictable? Should your answer be “yes”, then it’s time to have an eye for big data and business intelligence. Let’s give the above list a second look and pick one to have an ace up your sleeve.
You May Also Like:


